Time Series Annotation Tools
Time series annotation requires handling of sequential information as present in signals recorded over time.
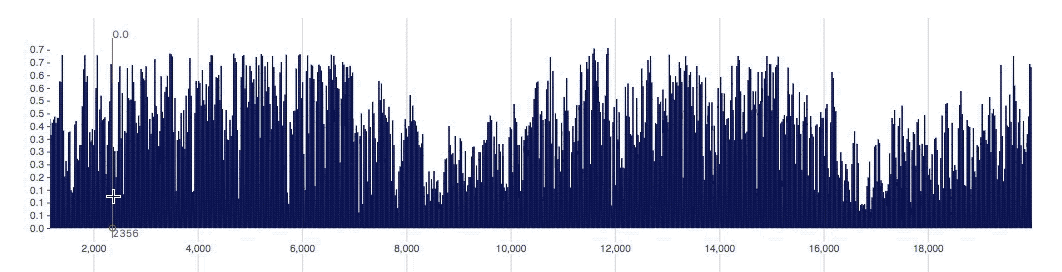
In contrast to NLP (text) or image annotation time series annotation requires the analysis of a signal over time. Think about listening to a small voice message and having the task of annotating it. Depending of the complexity of the singal the annotation process can take a multiple of the actual signal length. This means, that annotating a 10 second signal could take up to several minutes as the annotator needs to replay the signal several times at different speeds to properly annotate it.
In this post, I focus mostly in temporal or time series data other than audio as there are great tools dedicated for audio annotation.
Open Source Time Series Annotation Tools
There are several good open source tools for time-series annotation.
Baidu Curve (no longer maintained)
A very popular open source project was Curve from Baidu (the chinese Google). Unfortunately, the team decided to archive their GitHub repository due to lack of resources. You can still use the tool but the docs are not longer available and the tool is no longer maintained as of November 2022. Since the repo is read only external contributors can’t anymore contribute.
TagAnomaly by Microsoft

Another open source tool for time series annotation is TagAnomaly by software giant Microsoft. In contrast to other tools which typically use a web framework such as react, vue or angular, TagAnomaly is built around R. R is very popular among statisticians and has a UI framework called shiny that is used here. Since not everyone is familiar with R Microsoft also provides a Dockerfile to easily run the software in your browser.
Note that this tool is more used as an anomaly detection tool. You can find anomalies (manually or algorithmically) and then zoom in and have a closer look. It allows you to export anomalies to a csv file.
Wearables Development Kit (WDK)
This open source tool has been developed with activity recognition in mind for wearables. Think of the task of annotating whether a person is walking or running based on the accelerometer and gyroscope of your phone. Unfortunately, also WDK seems no longer to be maintained. But most functionality seems still working fine. A neat little feature is that you can playback videos in sync with the time series data. This of course only helps if you’re dealing with time series data where you have a video footage in sync.

LabelStudio by Heartex
A more recent time series annotation tool that is still actively maintained and gaining popularity is LabelStudio by Heartex. The tool also runs in your browser and besides times series supports all other major annotation types such as NLP (text) and images.
If you’re more interested in outsourcing the labeling work rather than doing it yourself using a data annotation tool I recommend to head over to the curated List of Data Annotation Companies.
Unfortunately, there are not too many time series annotation tools that are still maintained. If you know one that you can recommend but is not yet in the list please don’t hesitate to reach out or leave a comment!